
Anyone know what type of chart this is and a library that I can use to create it. Fusion Charts does not have it.
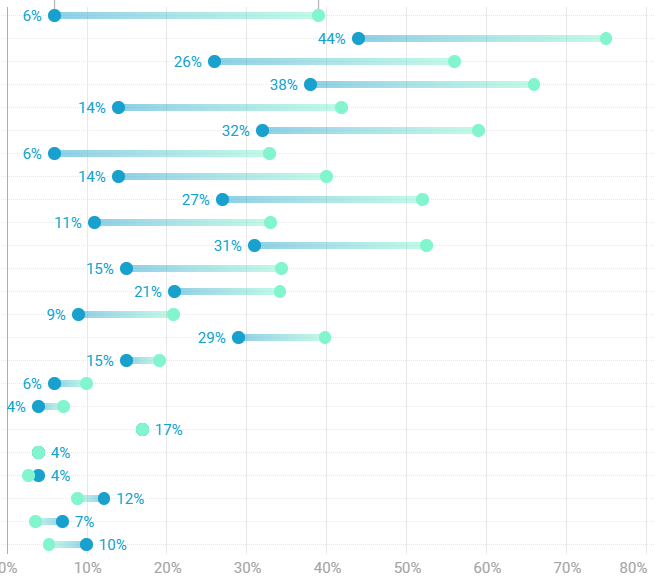
I found out what the chart is called. This is a range plot. It was created using datawrapper. Here is the site if anyone is interested. The free plan is decent and they have an API which you can easily incoporate in your scriptcase app or any other website if fusion charts does not have what you want and they do.