Bug - cannot get decimals on chart

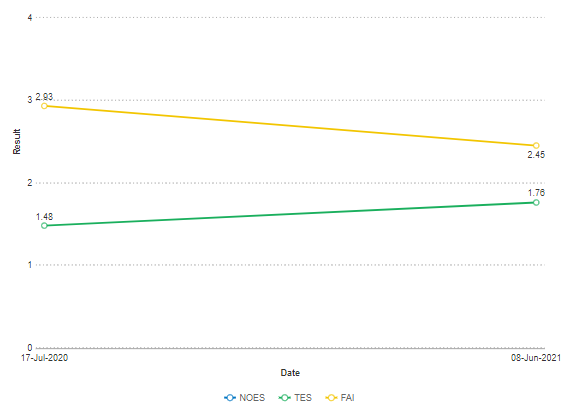
If you create a chart in SC9, based on a metric field which is Decimal or Float, the chart ignores anything after the decimal point. So a value of 4.2 shows on the graph as 4.

Under the metric field, you can change the Data Type from “Integer” to “Decimal”. You can also specify the number of decimal places. For instance, I can tell it to set the decimal places to 2. But then 4.2 gets shown on the chart as 4.00 so the underlying value is still getting rounded.

I can see this has been mentioned by several people on the forum but I cannot see any resolution or workaround.

Please can you comment and correct urgently? The charts are no good for detailed work like blood test results unless we can show decimal precision.

Thanks!

Hello,

I’m afraid the this is not a SC bug.

SC uses FusionCharts component to generate charts and unfortunately they don’t offer support to get decimals on metrics depending on the value.

However, you can try to increase the lines on the Y-axis(Metric) as a workaround. To do that, click on “theme” in chart’s menu and then in “Div Lines & Grids” and set the “Amount of horizontal lines” to maximum.

1 Like

I have the same problem. (Version 9.4.031)
Here in the demo, however, are displayed in decimal:
https://www.scriptcase.net/samples/php-charts/chart-lines/

Same problem (9.4.032)
Fields displayed as interger but they were setup with decimals
The summary shows values with decimals

In the end we gave up on the in-built charting and used the Fusion Charts library itself. It is a learning curve but we were able to do lots of extra things. And it shows the numbers with decimals.

image

2 Likes

Thanks for the response!

How do we get it right using fusion charts? but you are using same libraries but cant get it right, it is a huge bug as reportiing is not correct

Hi,
Finally I found the solution, it was simple…
In chart config, you have to disable “Abbreviated value” and the decimals appear !

regards.