Calculate like in Excel

Since nobody can help in the German area, I’ll try it here (with the help of Google Translate).

Attempts to output calculations for 4 weeks with certain filter functions, such as by date (total only from month xy) etc.
The sum of all entries (from one column) is relatively easy to do with a few clicks.

Concrete:
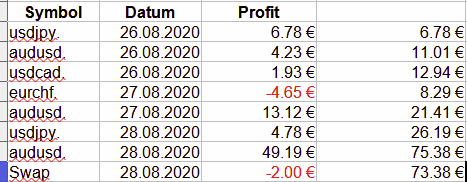
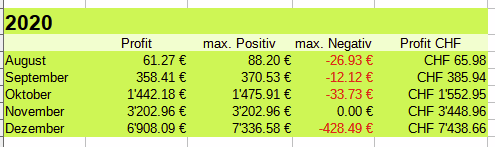
I have a few trading numbers every day which are stored in the table in the trading column. This value can be positive or negative. Then there is a date column where the date is stored in the format 2020-08-28.
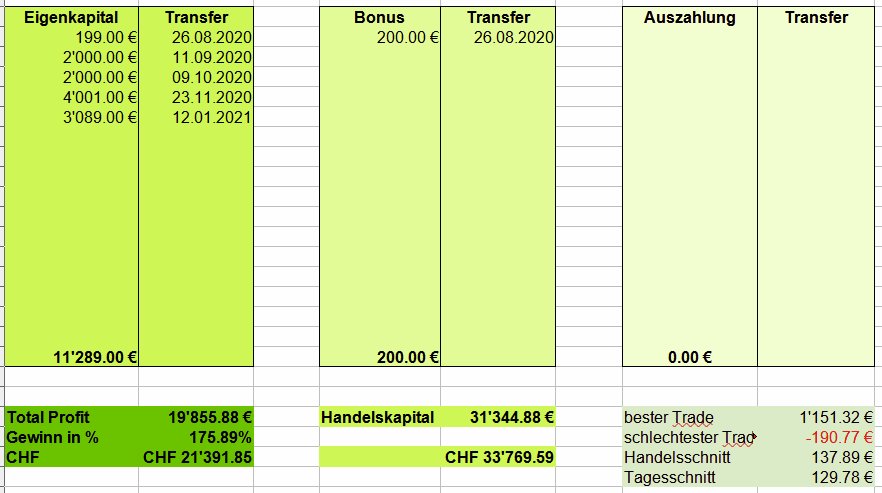
Now I would like to output a page where I have a table from January to December per year, with the total per month being displayed.

Of course this is only the beginning … but if I manage to do it, I would probably be able to create the other issues myself. :wink:

I am not quite sure which application I should create for it … form … grid … ???
And how can I integrate such a table (presumably using an SQL command)?
Would be really great if there was a little tutorial on this.
I didn’t find anything in Scriptcase under Tutorial.

And finally I would like to add 2 totals together. I have a profit column (including the total) and a fee column (including the total) … now offset these against each other.

At the moment I’m still doing my application with Excel … but I’d much prefer a web-based solution. Especially since I could finally use Scriptcase for something useful. ;))

Did you try to use the Group By function in the Grid

Thank you for your prompt reply.
I have tried to grasp the concept of grouping several times. Unfortunately, I never got very far.

I don’t understand why there isn’t a simple example of a tutorial on how to add a total income from total expenses and then output them as an absolute total.

And of course with the option of only for a specific month.

That would be the basis for a very simple cash book.

Basically that’s what Grouping is doing

Oh dear … I’ve watched the video 5 times for sure. I now have a bit of an idea what the groups are for. But unfortunately I still don’t have a solution to my problem with adding up.

Hello, could you please send us a screen copy of the result syou are waiting for and also a samples of Datas.
In your case what is the datasource ? MySql ?

Perhaps your request is near my screens like this one :slight_smile:


or this one :slight_smile:

I’ll try to make it clearer with an Excel table (no real data).

grafik
I enter this data every day (only the first 3 columns, the last one is calculated automatically).
Swap (OVERNIGHT FEES), which I now enter in Scriptcase in a separate column.
I would like to show the total of profit and swap (and then continue to use this number)
Example:
profit sum = 1000
swap sum = 50
profit sum - swap sum = real profit
1000-50 = 950

The following displays are on the overview page.


I have saved ‘Eigenkapital’ and ‘Bonus’ in a new table.
‘Total Profit’ is the value from above (real profit)
‘Gewinn in %’ is divided by the ‘real profit’ / ‘Eigenkapital’
‘Handelskapital’ is the sum of ‘Eigenkapital’, ‘Bonus’, ‘real profit’ and ‘Auszahlung (negative)’
Converting euros to Swiss francs is another topic :wink:

Finally, the monthly statistics (annually of course)
grafik
Profit column is simply the real profit achieved for the corresponding month (profit minus swap).
‘max Positive’ is the best trade this month.
‘max Negative’ is the worst trade this month.

I would be happy if I got at least a few possible solutions.

By the way, what’s the difference between grid and control?