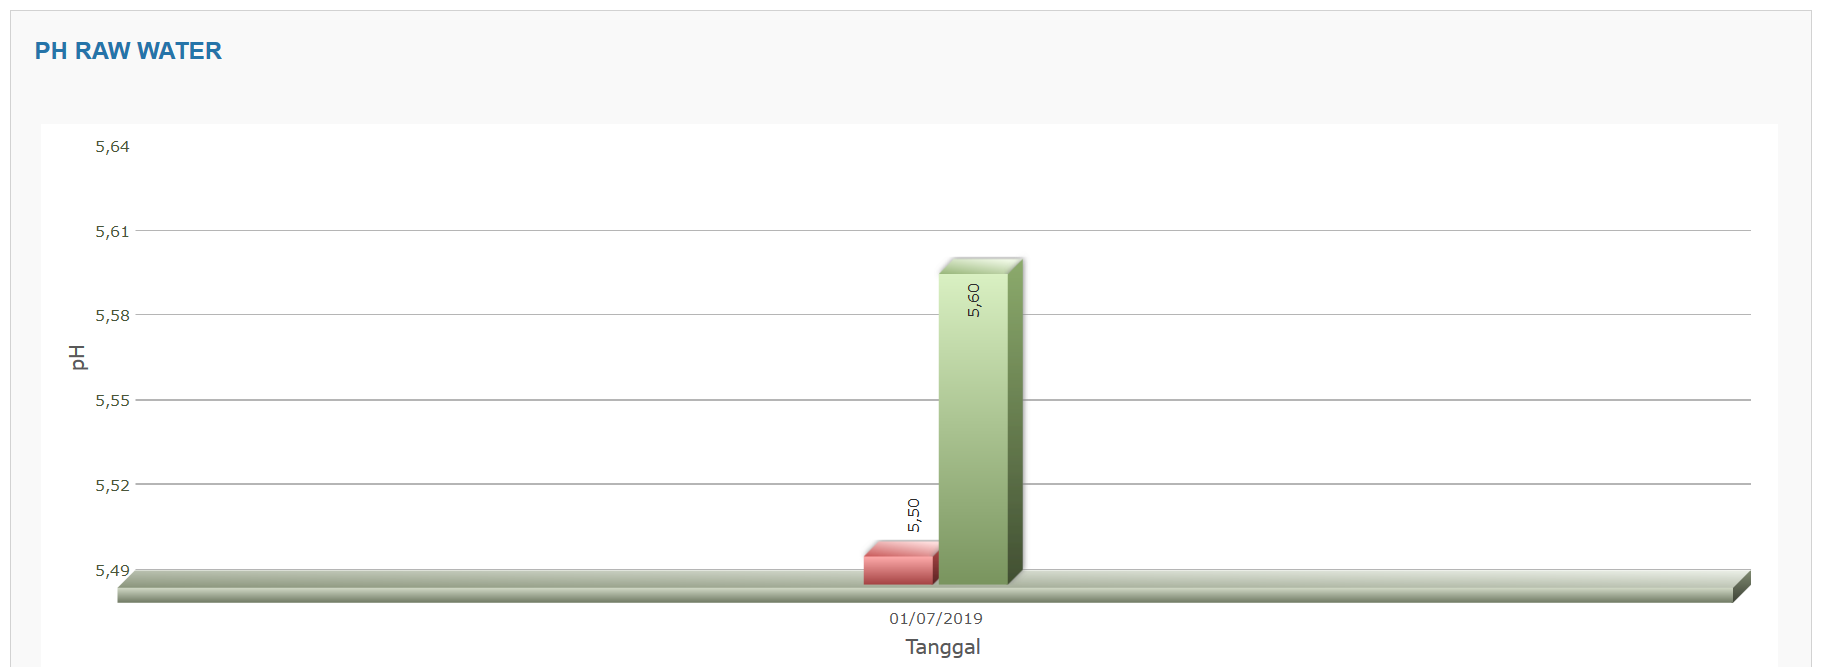
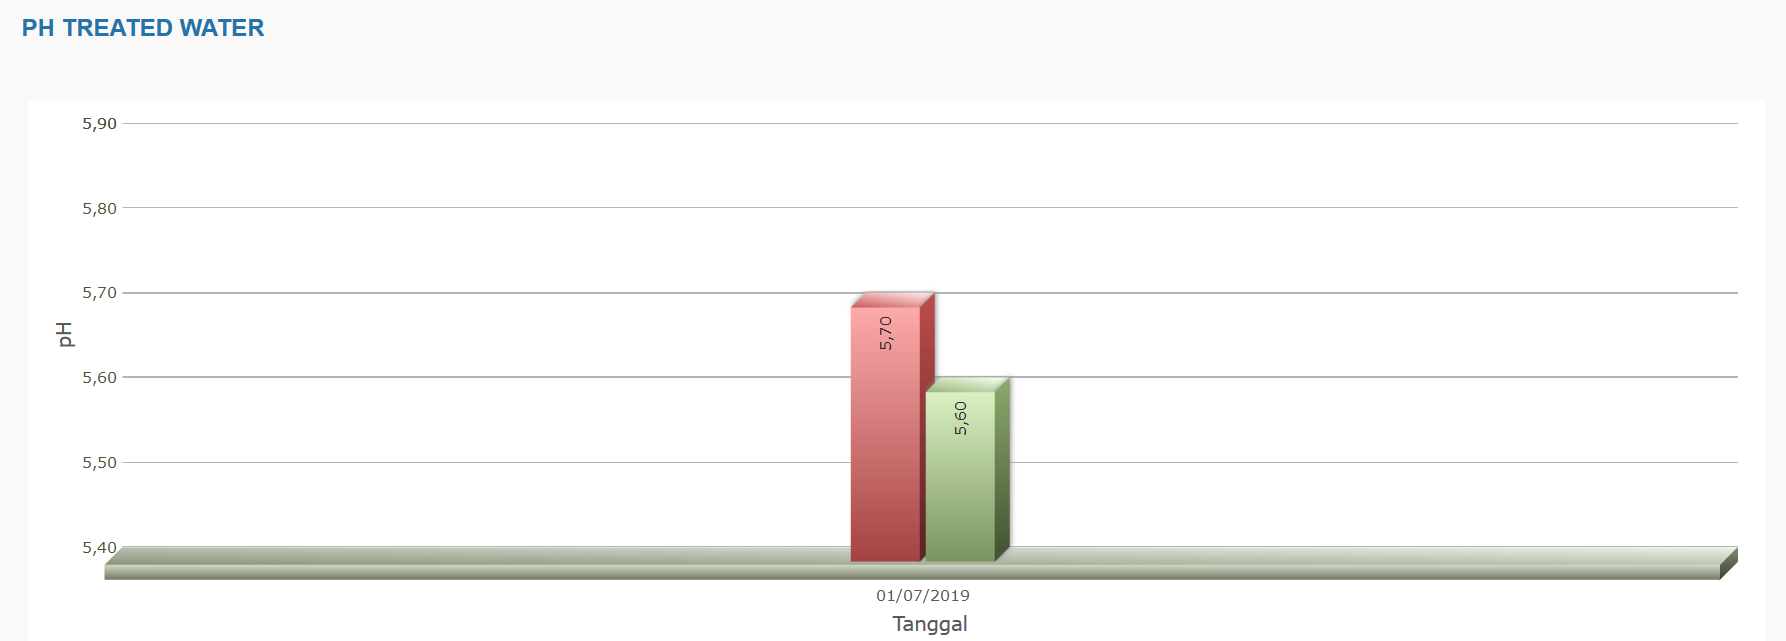
I create a chart application from the same table but it shows different result. In pH Raw Water the range is 0,03 but in pH Treated Water the range is 0,1.
How to make it become 0,1 ?
[ATTACH=JSON]{“data-align”:“none”,“data-size”:“large”,“data-attachmentid”:88215}[/ATTACH][ATTACH=JSON]{“data-align”:“none”,“data-size”:“large”,“data-attachmentid”:88216}[/ATTACH]


