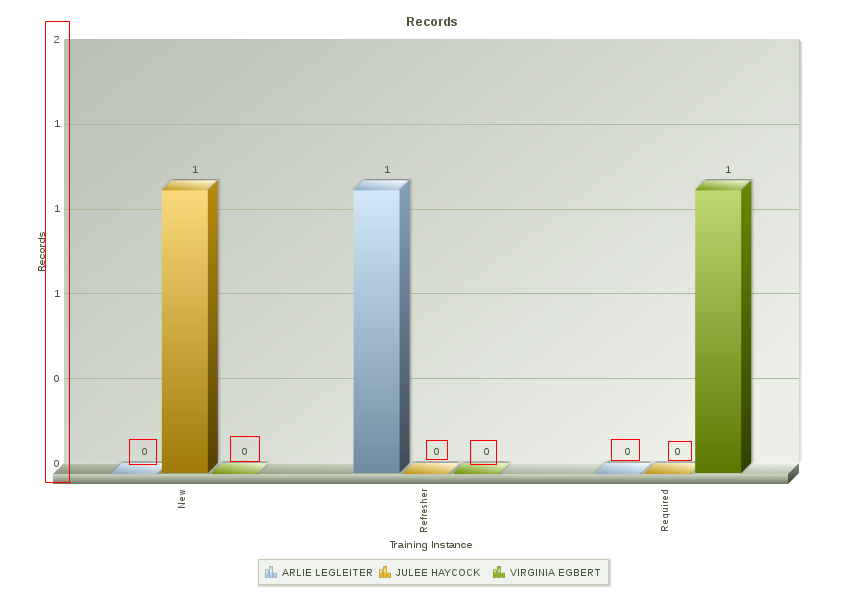
Take a look at the attached image. Notice the two 0’s and two 1’s on the y-axis? Why would a chart do that? Is the first 1 more 1 than the second 1? See the 0’s on the x-axis? Why do I need to see what doesn’t exist? I can’t sell this kind of junk to customers!

