Charts with filter in page, how POWERBI

Hi, all.

Someone try or make a CHART or another graphic with FUSION with filters in page???

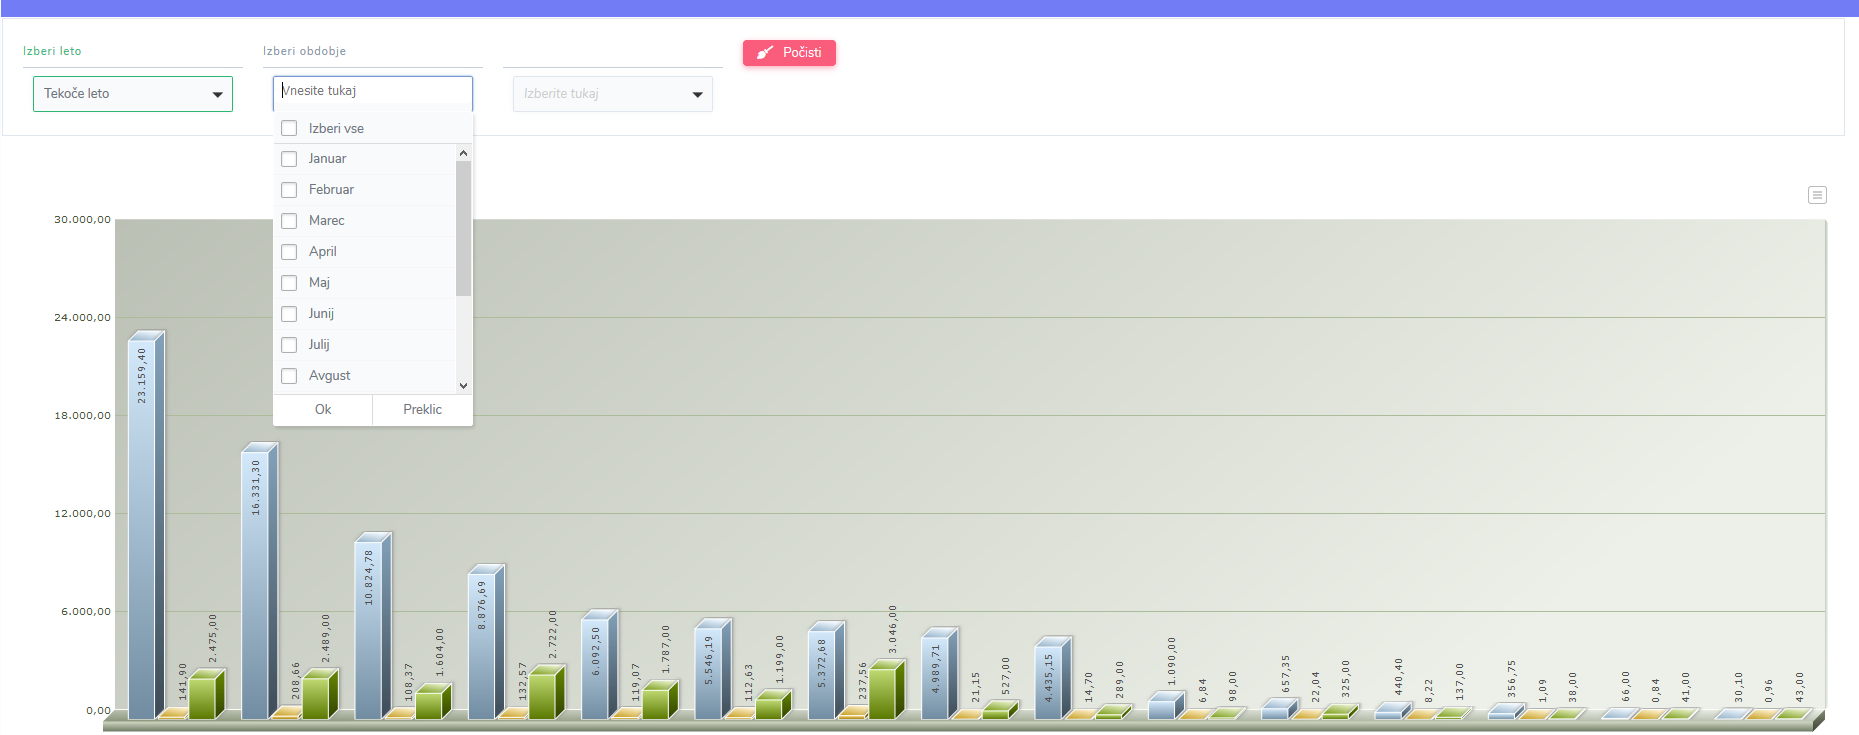
I need something like POWERBI, possibility to chose YEAR, MONTH and others FILTERS for a query and change the CHART.

I suppose it’s possible with AJAX.

Someone with one example or page to start this task!!!

Thank’s

Think like this:

[ATTACH=JSON]{“data-align”:“none”,“data-size”:“large”,“data-attachmentid”:89607}[/ATTACH]

temp.png

Just like that!!!

It’s possible share the idea, how put in same page the elements, I supose when un element change you execute onchange() and recharge de grafic…

I really not finish understand some logic in scriptcase…

Thank’s in advance for youe help…

Can you send any table from which you would like to make it?
That’s the easiest way. I give you a demo and you learn from it.
Via PM

Ok, thanks again, Gracias, Obrigado…

You have a demo on PM.

Rik, I’m sorry, it’s possible indicate what version Sscriptcase you use.

I try to import, bu indicate it’s not 9 version, but file indicate 9, I suspect my version it’s last one, I download few days ago.

Thank’s again…

New version on PM.