Debugging from Client Side

I’m looking for options to do debugging from client side.

Right now I tried FirePHP and Kint. I remember had some troubles with FirePHP I need to give another try, but I like too much how debugging go to console, but due to first is needed the create an instance, and recover it, I had troubles doing this in some situations in the code.

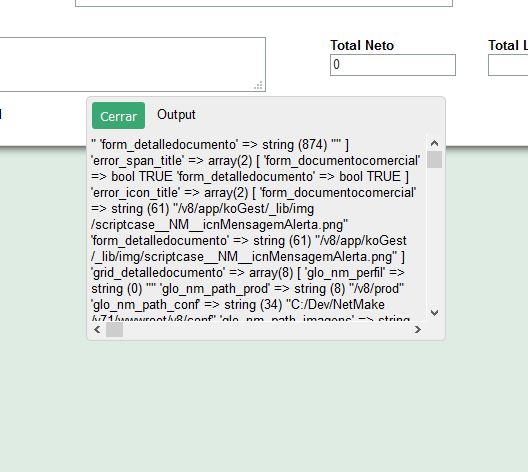
Kint right now works as expected, but because it show output in same page, when used inside a PHP method, it shows the output in the SC output window, and is difficult to read, and “trees” ouput can’t expand.

Do you know others options? do you know how to avoid the ouput on SC Output popup?

Captura.JPG

on Chrome - PHP Console extension (plus needs a server library put in your dev web root)

https://github.com/barbushin/php-console

Uhm…looks like FirePHP, but on Chrome. I don’t use Chrome, but I will put it on my ToDo to give a try

With Kint there are modifiers that make output non-HTML or redirect output so you can write it to a file for example. That may help?

Text-only output
To output variable info in a lightweight, HTML-free fashion use

<?php
s( $variable );
// and
sd( $variable ); // to exit immediately afterwards

The output is whitespace-formatted and uses no HTML/CSS/JS. It still HTML-escapes variables though.

Real-time modifiers
Kint also uses a non-standard PHP feature: modifiers. This is not a language feature; Kint achieves that by analyzing code that was used to call the dump functions (long story :).

<?php
+Kint::dump( $variable );
// or, as usual
+d( $variable );

Available modifiers:
+Kint::dump(); will bypass the nesting depth limit.
When outputting very complex objects, you may receive DEPTH TOO GREAT messages, use this modifier to ignore them for that one call.
Be warned, it may cause your browser to hang in extreme cases.
-Kint::dump(); will clean all previous output to screen before displaying the dump.
Use it to show the dump at the very top of the page.
Extremely useful when dumping variables inside HTML; powerful combined with dd();
Be warned, it may cause your browser to hang in extreme cases.
May fail to work in rare cases when ob_clean() and ob_start() are used beforehand.
@Kint::dump(); will return the output of the Kint::dump() instead of displaying it on screen.
Useful for logging to file.
!Kint::dump(); will display the dump expanded by default so you don’t have to click :slight_smile:

Giu

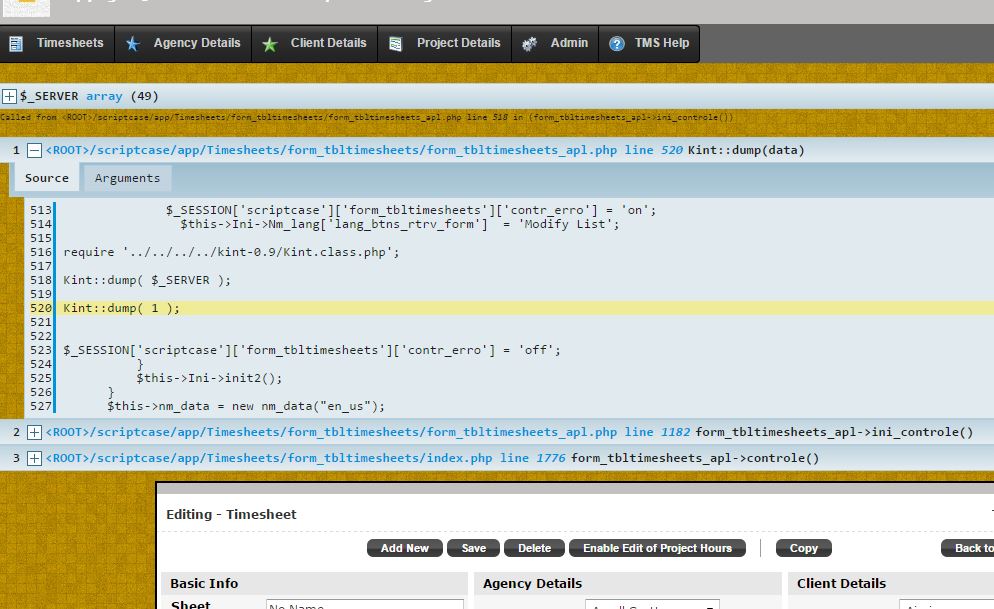
Not sure if this is what you mean but I got Kint working “properly” by doing it outside SC libraries (unsure how persistent, but it works):

In SC’s Apache root I extracted Kint into a folder “Kint-0.9” (in “wwwroot”).

In app’s onApplicationInit - just standard non-SC PHP:

require '../../../../kint-0.9/Kint.class.php';

Kint::dump( $_SERVER );   // This can of course then be in any event

Kint::dump( 1 );         // Ditto

See picture…

Capture.JPG

Yes adz, now create a PHP Method, , put this code there, and call this method from an Ajax onChange or something like this.

You are making it difficult. I you want to debug on the client side then simply use install and xdebug. That is THE best way to do it (unless you use another php debugger of course).
With that you can simply single step through the php code.
Clients are here: http://xdebug.org/docs/remote I always use the standalone xdebug client tho netbeans seems to work as well. But I find it overdone for such a simple debug task.
Install the proper xdebug client in your php extensions folder if it isnt installed and allow the port (usually 9000) to be accessed.
Lock the port access on the firewall to your client machine if you are the developer, you wouldnt want anyone other then yourself to debug your php, of course.
I have successfully found my bugs in the generated code using this scheme…

Giu - will try out later.

rr - you are absolutely right. And for thorny issues that’s exactly what I do.

However, it’s a real pain for me as my dev is on Ubuntu 14.04 which is PHP 5.5, so I need to run my xdebug etc on 5.4 under a 12.04 VM. Which is of course more slower and annoying than just debugging in the native dev environment (roll on 5.5+ support in Zend!). So, unless I really need to step through code, nice var dumps or tracebacks suffice for a large amount of debugging effort - and Kint is very good at that.

[QUOTE=rr;36390]You are making it difficult. I you want to debug on the client side then simply use install and xdebug. That is THE best way to do it (unless you use another php debugger of course).
With that you can simply single step through the php code.
Clients are here: http://xdebug.org/docs/remote I always use the standalone xdebug client tho netbeans seems to work as well. But I find it overdone for such a simple debug task.
Install the proper xdebug client in your php extensions folder if it isnt installed and aHillow the port (usually 9000) to be accessed.
Lock the port access on the firewall to your client machine if you are the developer, you wouldnt want anyone other then yourself to debug your php, of course.
I have successfully found my bugs in the generated code using this scheme…[/QUOTE]

Hi rr,

Yes, I now about XDebug. I have installed and configured in my SC instance. But I didn’t found any light(*) PHP IDE to debug properly. Eclipse is a pain taking memory, Netbeans equal, can’t get CodeLobster to work with it’s own debugger.

I discarted XDEbug client because looked outdate to me. I tried right now, and I can get to step forward once a breakpoint is reached. I can’t search over script, to put breakpoints where I want, and so on…

I will try again with netbeans again and take a look.

(*) I mainly develop on a Surface Pro 2, 4GB ram, and I have to run SC, IDE, database, skype, firefox, and so on…
Why would you need a light php ide for debugging? xdebug shows the php code by itself.
Anyway the moment you open a new php file due to a class that gets entered or so, that is the moment that that php codeis loaded in xdebug.
ANyway supposedly xdebug also works with ultraedit studio: http://www.ultraedit.com/support/tutorials_power_tips/uestudio/integrated_php_debugger.html (I didnt try it yet).
You may also find this interesting… http://devzone.zend.com/1147/debugging-php-applications-with-xdebug/
And via firefox: http://www.phpedit.com/en/support/tutorials-videos/tutorials-debugger#firefox-toolbar

Well you know how to do the google thing quite wellI bet…

Mainly because You can’t search or move easily on files, and you know some SC generated files are very big. If I want to debug some event, first, I need to show code, search for my code, take note of the line, then from xdebug move manually to this line of code, and so on…

You got a point there. I hope they changed it properly with php 5.6. php dbg is added in 5.6 standard.

For the record, I got XDebug working with SublimeText and seem to work ok. I need more testing.