(Debugging Tools) Use Nette Tracy to debug code in Scriptcase

To integrate the Tracy debugger into Scriptcase, follow these steps:

  1. Enable mod_rewrite in Apache.

  2. Place the tracy folder in the server’s root directory (e.g., /var/www/html/tracy). Attached file: tracy.zip
    tracy.zip (152.7 KB)

  3. On php.ini
    error_reporting = E_ALL
    display_errors = On
    display_starup_erorrs = On

  4. Place the .htaccess file in the folder:
    /var/www/html/scriptcase/app/
    with the content:
    php_value auto_prepend_file "/var/www/html/tracy/index.php"

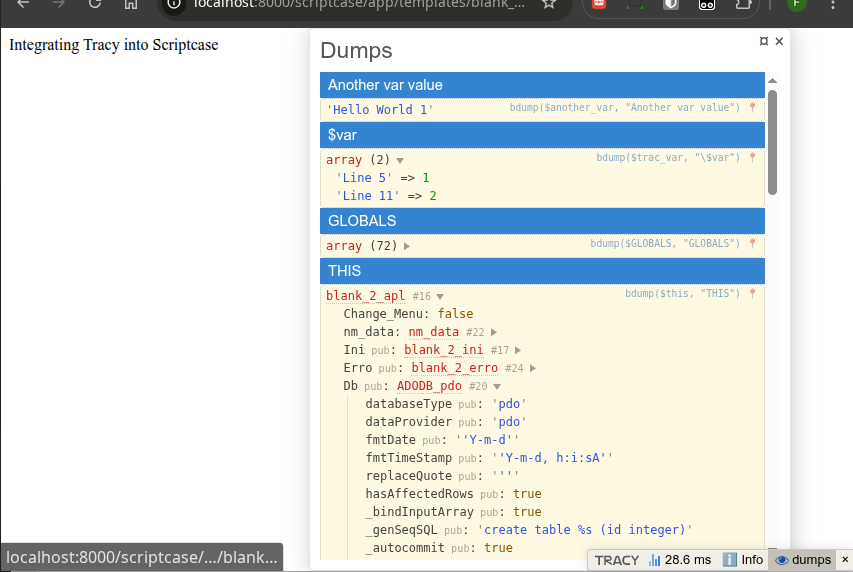
This integrates the Tracy debugger, which adds a bar to the bottom right corner.

Code to test:
image

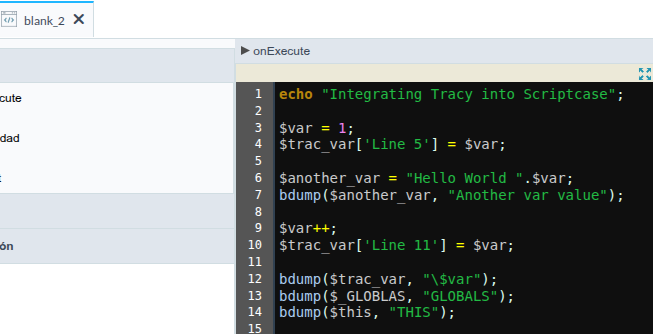
echo "Integrating Tracy into Scriptcase";

$var = 1;
$trac_var['Line 5'] = $var;

$another_var = "Hello World ".$var;
bdump($another_var, "Another var value");

$var++;
$trac_var['Line 11'] = $var;

bdump($trac_var, "\$var");
bdump($_GLOBLAS, "GLOBALS");
bdump($this, "THIS");

Result

More information at

Handle PHP Errors with Full Stack Trace Using Tracy Debugger

Tracy intercepts errors and renders a comprehensive debug screen with full stack trace, request details, and environment variables for in-depth analysis.

Debug PHP Variables Instantly Using bdump() in Tracy Debug Bar

Quickly inspect PHP variables using bdump() and view structured data in Tracy’s debug bar.

Measure Execution Time in PHP Easily with Tracy Debugger Timers

Measure execution time in your PHP code using Tracy Debugger timers and identify performance bottlenecks with ease. Start and stop timers around critical sections and view precise timing results directly in the debug bar for faster optimization.

Explore more features like AJAX request debugging, detailed error screens with stack traces, logging, and powerful debug panels that give you full insight into your application.