Problems with grid graphics
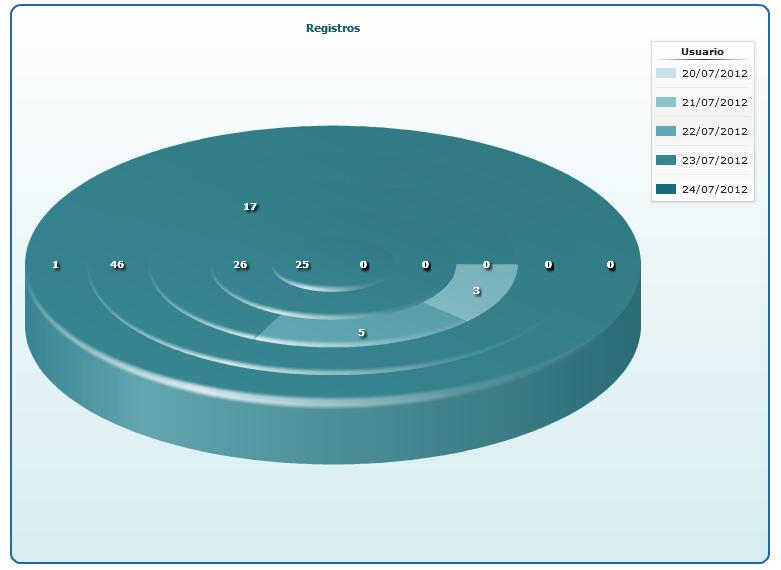
I’m doing a report and this need to generate a chart with a date and a user name of a database, the problem is to do a double “Group by”, then the graph of circularly ordered me inside out in circles on order by date within each circle and users made modifications to the DB on that date …
the problem is that in the square where colors are defined an error in reference to the colors in the graph are presented