Hi everybody…
I need some help by creating a grid with a little chart, please… here is my problem:
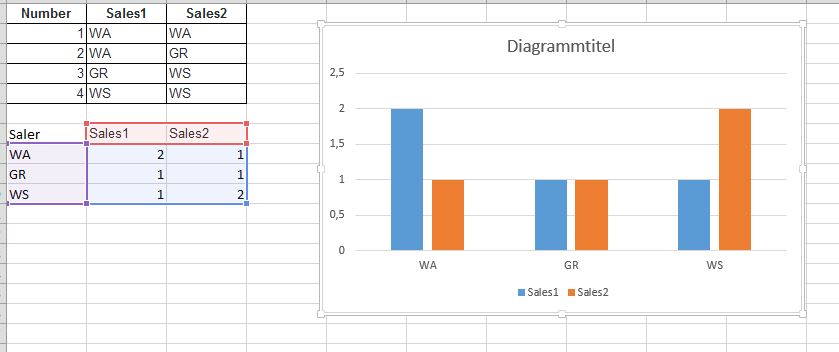
The result of my SQL is like this: [TABLE=“align: left, border: 1, cellpadding: 1, width: 500”]
[TR]
[TD]Number[/TD]
[TD]Sales1[/TD]
[TD]Sales2[/TD]
[/TR]
[TR]
[TD]1[/TD]
[TD]WA[/TD]
[TD]WA[/TD]
[/TR]
[TR]
[TD]2[/TD]
[TD]WA[/TD]
[TD]GR[/TD]
[/TR]
[TR]
[TD]3[/TD]
[TD]GR[/TD]
[TD]WS[/TD]
[/TR]
[TR]
[TD]4[/TD]
[TD]WS[/TD]
[TD]WS[/TD]
[/TR]
[/TABLE]
ok, that?s easy. Now I wan’t to have a Chart for that, but Sales1 and Sales2 should be a own Bar.
Like this:
[ATTACH=CONFIG]n70591[/ATTACH]
Maybe it is possible to realize it by using a chart only app, but then it is not possible to link it to a grid. I want to click on a bar and should be redirected to the grid which show?s me the details.
Somebody is able to help me?
Thank you!