Hi,
There are two questions about charts:
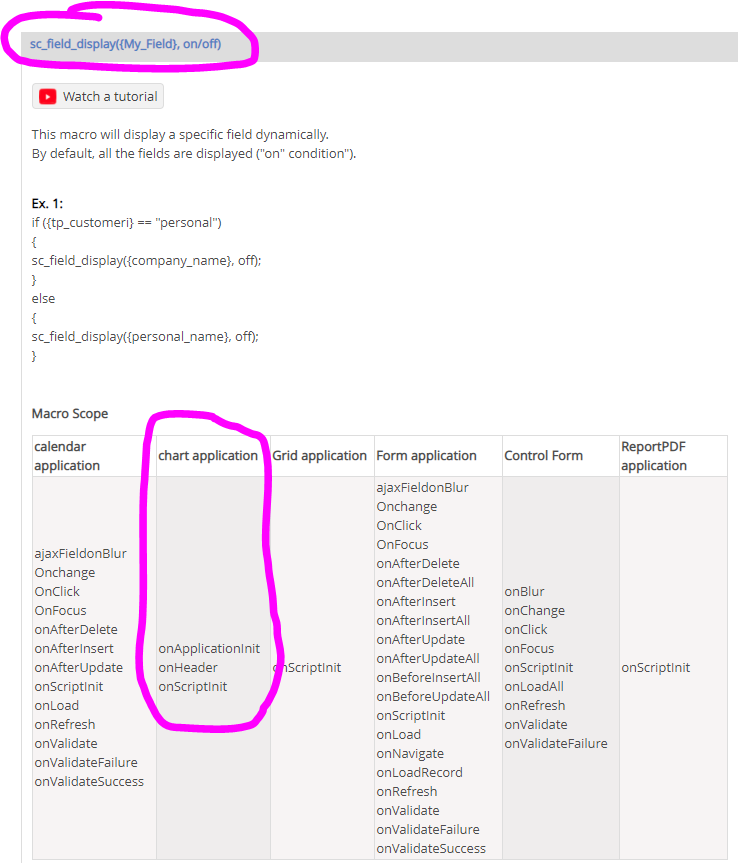
Is there a way to hide some fields (metrics) of a chart application
I’ve a set of metrics, but the number of metrics to show is not the same for all users
I’ve tried with sc_field_display but it doesn’t work.
The second, how can I set a range for the y-axis? The min and max values are set by SC. I need to fix at least the max value.
any idea?
thanks.