Hello,
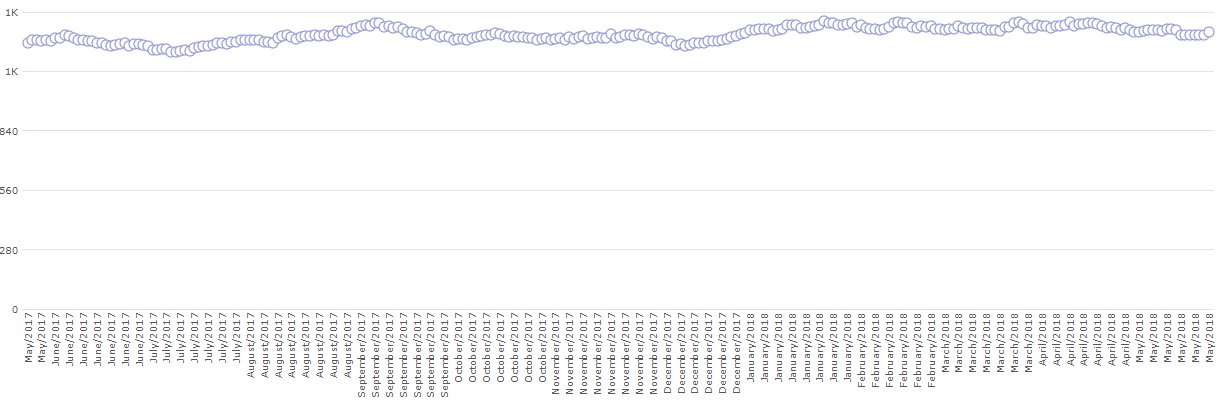
I would like to adjust the y axis of the line chart below, so that it does not start from 0 but closer to data range ploted within the chart. The data range goes from 1210 to 1540. How can I do this? many thanks.
[ATTACH=CONFIG]n83604[/ATTACH]