Hello 
Would have two questions about charts :
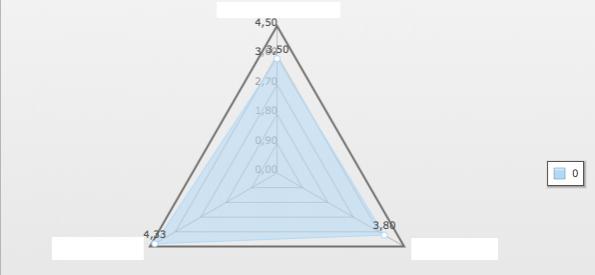
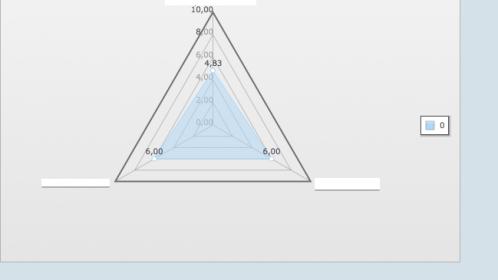
1- How can I do to fix the maximum value on a chart ?
Example : I have a radar graph. When I read it with some values the max is 10. Then i read the same graph with other datas and the max is 4,5 !
That is quite anoying to compare objects… I would like to set the maximum at 8 for example whatever are the datas displayed.
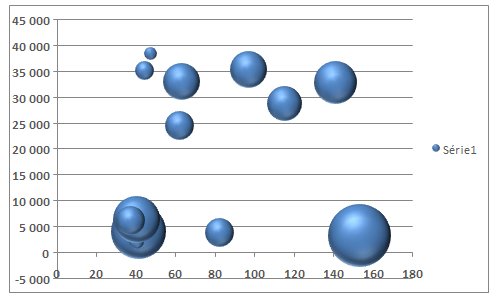
2- Is it impossible to make bubble chart like in Excel or this one ? Those are very important for my work.
Thanks !