Hi
I’ve a scatter char with 1 dimension and 2 metrics
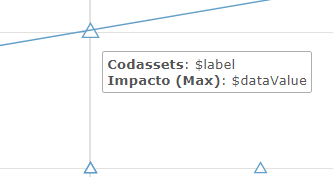
The info (each point) is displayed but when you mark each point in the graph the following info is displayed insted the correct info:


Hi
I’ve a scatter char with 1 dimension and 2 metrics
The info (each point) is displayed but when you mark each point in the graph the following info is displayed insted the correct info:
