It is possible and how can i change the Semicirular Gauge that Zero is always top middle?
And second question about that. How can i change and set my own min / max value?
Thanks in advance.

It is possible and how can i change the Semicirular Gauge that Zero is always top middle?
And second question about that. How can i change and set my own min / max value?
Thanks in advance.
I would like the following solution
Thank you for your answer.
Do you mean chart.js? (Simple flexible JavaScript chart library)
I just found and looked at that and it might solve my problem, with a little familiarization.
But does that also mean that, if I understand you correctly, I can assume that there is no solution that has scriptcase directly on board (a property, a few lines of code) that can be used or customized?
Yes, that’s it. Unfortunately about graphs, Scriptcase is miles away from good options to give us the freedom to create what we need.
OK, that’s a sad thing.
But, thank you so much for your time and tip.
I think I will use your idea and approach to create a temporary solution.
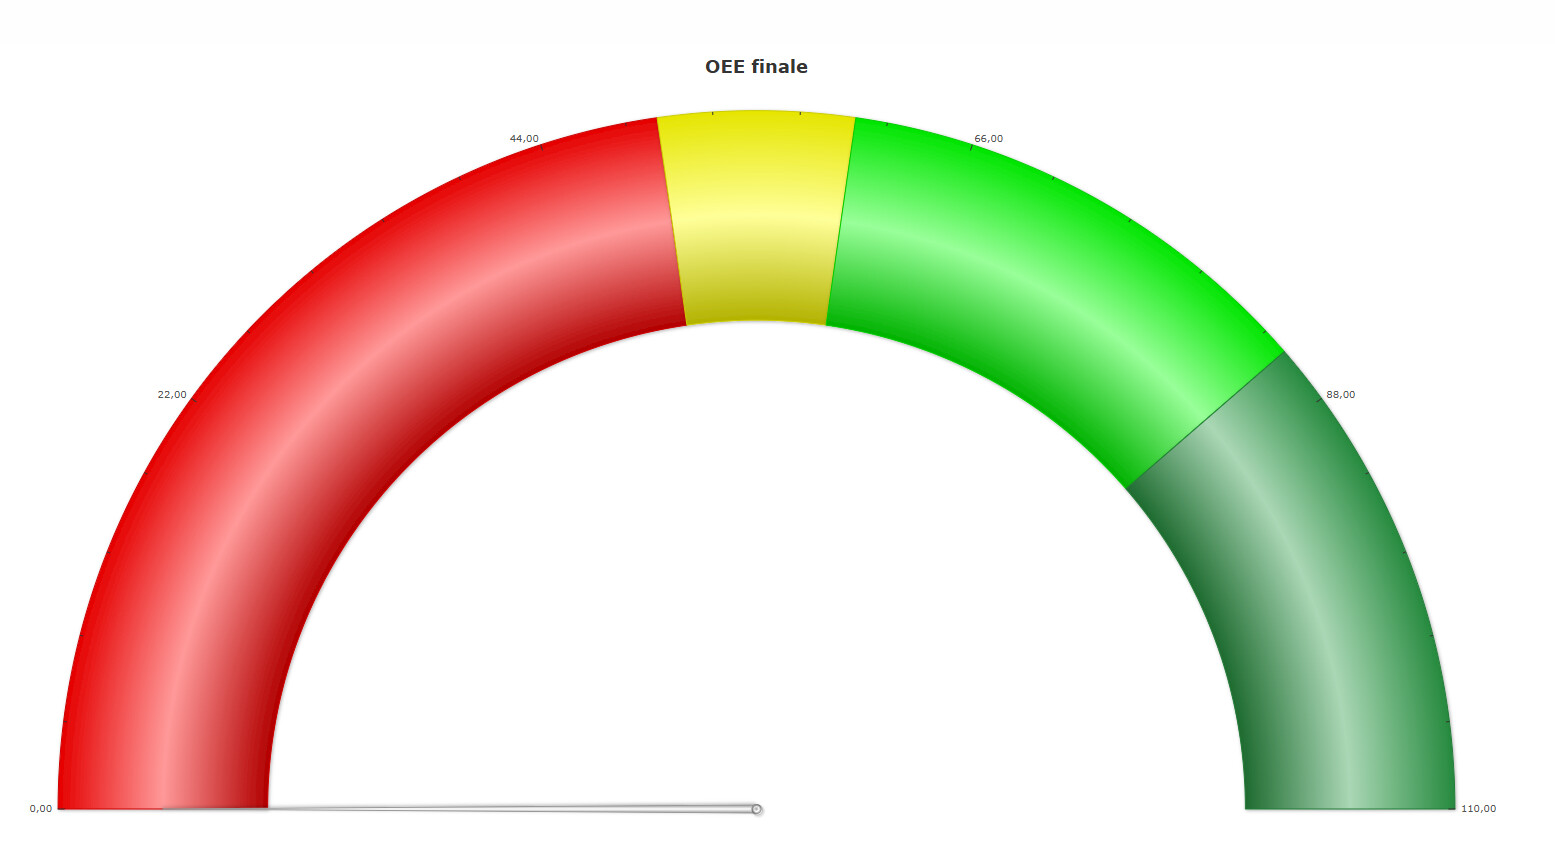
try this, look in the webpage source and find the name of the entity of the graph, in my case if myChart, for you probably is the same, then in the scriptinit event write some javascript code to “modify” the graph according the API, I don’t know if what you need is possibile to modify via js code, however I made some modification to my gauge, for example center the title, and the gradient color.
?>

<script>

$( window ).on( "load", function() {

		myChart.setChartAttribute({
			// caption: "Chart Caption Text",
			// subCaption: "Chart Sub Caption Text",
			gaugeFillMix: "{dark-30},{light-60},{dark-10}",
			gaugeFillRatio: "15",
			captionAlignment: 'center',
		});

});
<?php
bye
Many thanks!
This is also an option for me. This looks promising. I will have a look and try it out!
Thank you very much for your help.
It has now taken some time for further research.
I would like to share the current status.
Unfortunately, the suggestion/solution does not work… Because the FusionChart is not available at the right time, to manipulate the properties. (However, the approach is what I was looking for as an alternative solution.)
The reason could be, among other things, the new Scriptcase version (9.12)…
But perhaps someone has another idea or even a solution?
If I am doing something wrong or pursuing the wrong approach, I am grateful for any hint. Thank you.
A test script to try out.
Chart-App → ScriptInit:
?>
<script>

// window onload
$(window).on("load", function() {

	console.debug("My OnLoad : FusionChart adaption.");
	console.debug("scCombChartId: ", scCombChartId);
	console.debug("scFusionChartsType: ", scFusionChartsType);

	checkFusionChartAvailable();

	// list all global value
	//listGlobalVariables();
    }
);

// window resize
$(window).resize(function() {
   checkFusionChartAvailable();
});

// debug output : FusionChart
function checkFusionChartAvailable() {
	console.log("check FusionChart(var=scFusionCharts) available:");

	if (typeof scFusionCharts === "undefined") {
		console.error("Chart is not available!");
	}
	if (typeof scFusionCharts !== "undefined") {
		console.log("Chart is AVAILABLE! (YES!)");
	}

};

// list all globale variables
function listGlobalVariables() {
    // check properties of window
    for (let key in window) {
        // Filter out only your own properties (no inherited ones)
        if (window.hasOwnProperty(key)) {
            console.log(key, "=", window[key]);
        }
    }
}
</script>
<?SOLVED! (Is there any way to customize the title of the post?)
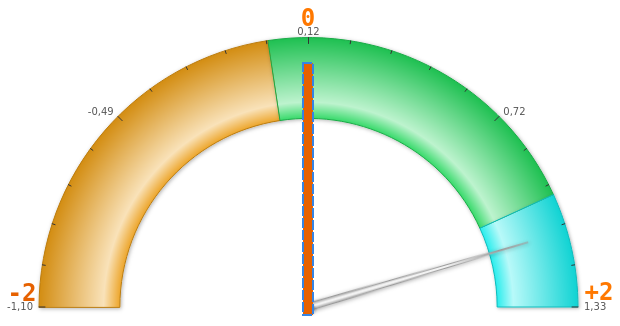
Thank you for the important impulses, I have found the following transitional solution.
ScriptInit:
?>
<script>
$(window).on("load", function() {

    console.debug("My OnLoad : FusionChart adaption.");
    console.debug("scCombChartId: ", scCombChartId);
    console.debug("scFusionChartsType: ", scFusionChartsType);

    connectToFusionChartEvents();
    }
);

function connectToFusionChartEvents() {
    // connect at "rendered"
 	FusionCharts.addEventListener("rendered", function() {
     	adaptFusionChartSettings();
        });
};

function adaptFusionChartSettings() {
    console.log("adapt FusionChart properties.");

	if (typeof scFusionCharts !== "undefined")
    {
        console.log("Chart is AVAILABLE! (change properties!)");

	  // adapt chart attributes
	   scFusionCharts.setChartAttribute({
               caption: "BLABLA B",
               subCaption: "Chart Sub Caption Text",
               gaugeFillMix: "{dark-30},{light-60},{dark-10}",
               gaugeFillRatio: "15",
               captionAlignment: "Left",
               height: "25%"});

       scFusionCharts.setChartAttribute({
       		lowerLimit: "-2",
	       	upperLimit: "2"
	        });
   }
 };
</script>
<?php